Group Emotion Recognition
Computer Vision and Deep Learning for Collective Mood Analysis
View Interactive NotebookProject Overview
This project develops an automated system for analyzing collective emotions in group photographs by detecting individual faces, recognizing their emotions, and aggregating them to determine the overall group mood. Built on Google Vertex AI infrastructure for scalable processing and model deployment. The system has practical applications in assessing employee satisfaction at corporate events, measuring student engagement in educational settings, evaluating attendee sentiment at conferences, and understanding collective well-being in social gatherings. Using advanced computer vision and quality-weighted aggregation, this project provides insights into group dynamics without requiring subjective human labeling.
Key Objectives
- Develop an automated pipeline for detecting and analyzing emotions in group photos
- Compare multiple face detection algorithms to identify the most effective approach
- Implement quality-weighted aggregation to produce reliable group-level emotion predictions
- Evaluate system stability and uncertainty using label-free metrics
Dataset
Source: Approximately 3,000 group images scraped from the internet
Characteristics: Real-world, unconstrained images with diverse lighting conditions, face sizes, angles, and group compositions
Annotations: Manual labeling using Label Studio for validation and ground-truth comparison
Key Metrics Tracked:
- Face count per image (from individual faces to large crowds)
- Face quality scores based on size, resolution, and clarity
- Blur measurements using Laplacian variance
- Face aspect ratios and bounding box dimensions
Sample Visualization
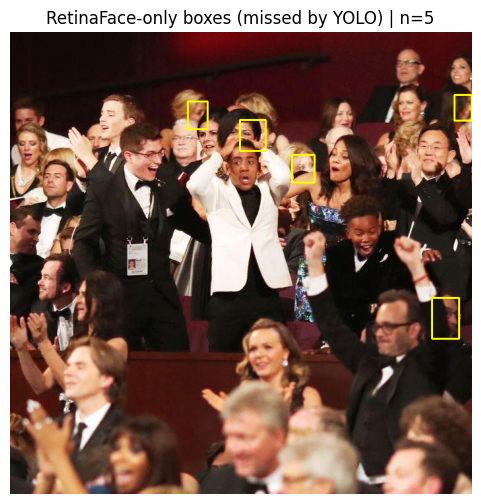
Comparison of face detection results: RetinaFace vs YOLOv8-face showing detected faces in group images
Methods & Techniques
Face Detection Algorithms Evaluated:
Emotion Recognition & Aggregation:
- DeepFace Framework: Used for facial attribute analysis and emotion classification
- Quality-Weighted Majority Voting: Top-40 faces selected based on quality scores
- Weighting Formula: w_i = clip(quality_i, 0, 1) + epsilon
- Quality Filtering: Minimum face size thresholds and blur score computation
Label-Free Evaluation Metrics:
- Stability Analysis: Jensen-Shannon Divergence (JSD) to measure consistency under face subsampling
- Uncertainty Quantification: Shannon entropy of predicted emotion distributions
- IoU Analysis: Intersection over Union for comparing detector outputs
Quality Analysis Visualization
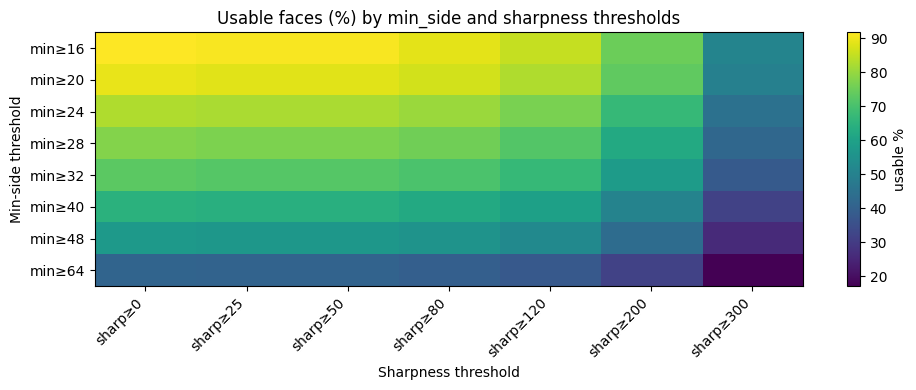
Quality analysis heatmap showing the relationship between face size, sharpness, and usability for emotion detection
Results & Performance
Key Findings
- Best Face Detector: RetinaFace significantly outperformed YOLOv8-face, recovering 29 usable faces vs 24 in crowded scenes and showing superior multi-scale detection capabilities
- Group Size Matters: Small groups (1-2 faces) show high variability and unreliable predictions despite appearing confident; predictions stabilize and become representative with 10-15+ faces
- Entropy as Emotional Diversity Indicator: Low entropy indicates emotionally coherent groups with dominant single emotions, while high entropy reveals genuinely diverse emotional compositions
- Quality-Weighted Aggregation Benefits: Produces stable group-level distributions as group size increases, with strong inverse relationship between entropy and distribution peakiness
- Label-Free Evaluation Success: The behavior-based evaluation framework successfully assesses system reliability without requiring controversial subjective ground-truth labels
- Practical Insight: System captures multiple concurrent emotional signals in real-world groups, treating group emotion as a probabilistic distribution rather than a single categorical label
Technologies Used
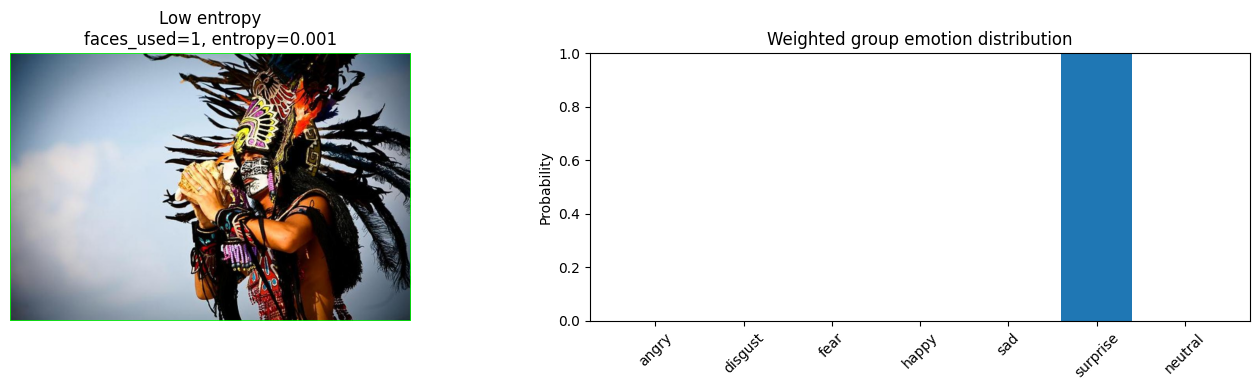
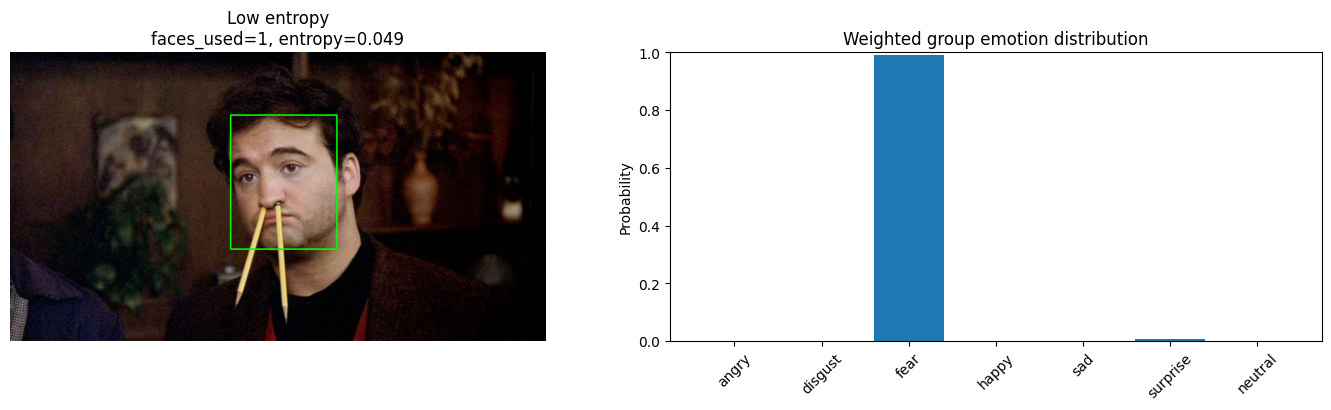
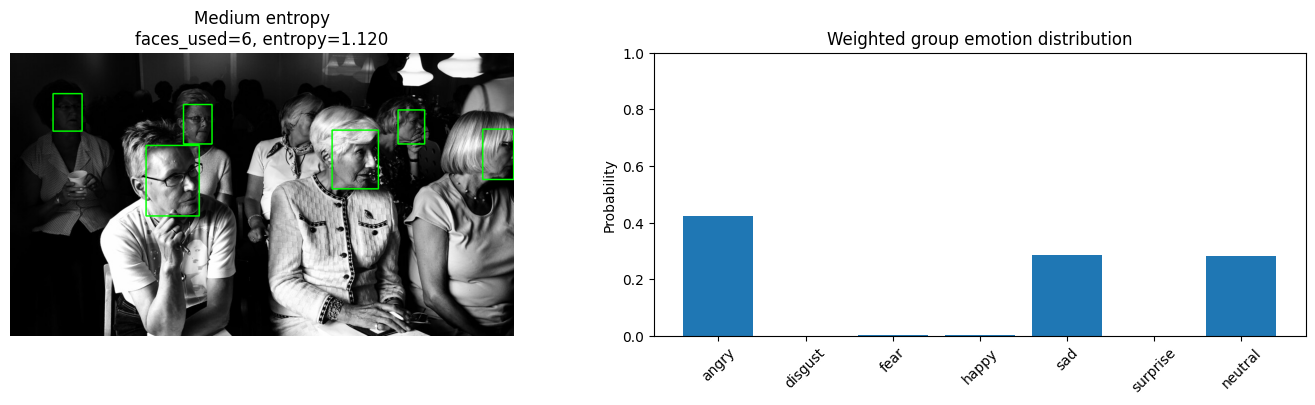
Entropy and Emotional Diversity: Key Examples
The following examples demonstrate how entropy quantifies emotional diversity in groups. Low entropy indicates emotionally coherent groups (dominant single emotion), while high entropy reveals genuinely mixed emotional states.
Low Entropy Examples (Emotionally Coherent)
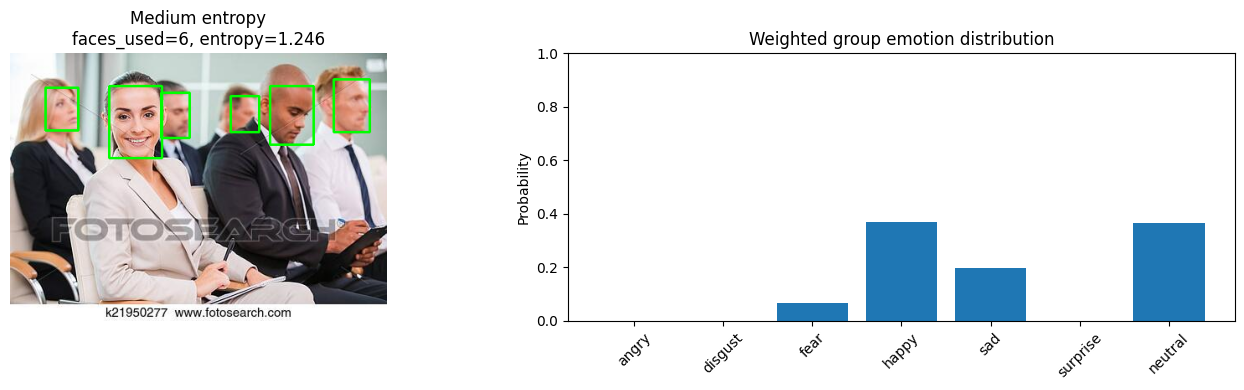
Medium Entropy Examples
High Entropy Examples (Emotionally Diverse)
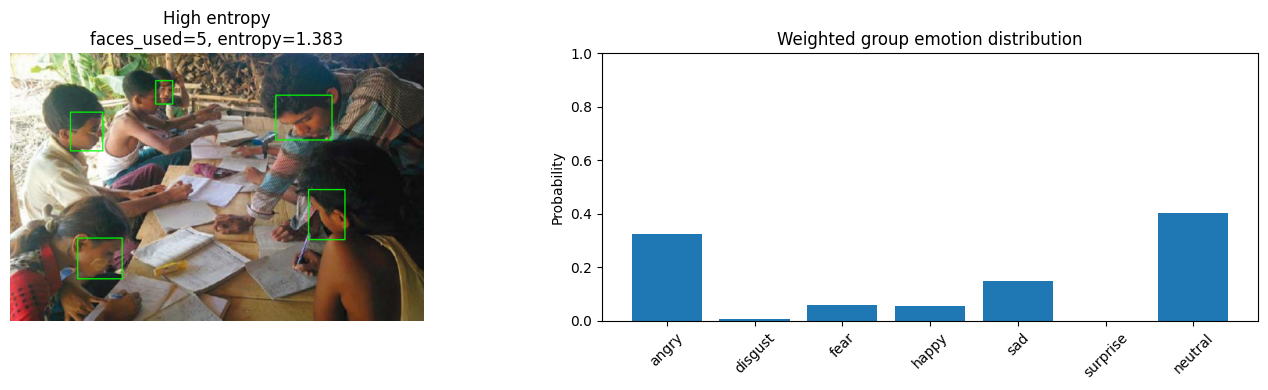
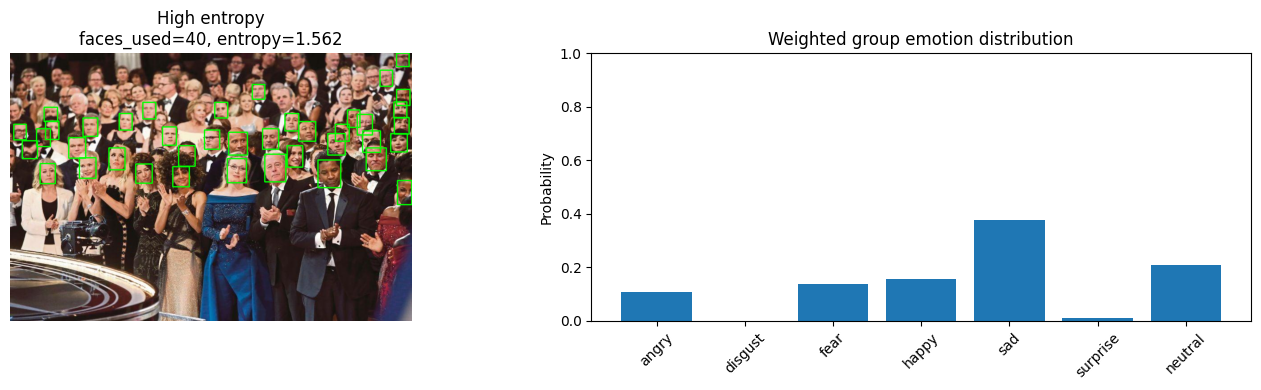
Each visualization shows: (left) group image with detected faces, (right) weighted emotion distribution. Entropy values quantify the spread of emotions across the group.
Innovation Highlights
This project introduces a novel behavior-based, label-free evaluation framework that avoids subjective ground-truth labeling by focusing on:
- System consistency and stability under perturbations (face subsampling)
- Distributional properties (entropy, peakiness, diversity metrics)
- Relationship between group size and prediction reliability
By treating group emotion as a probabilistic distribution rather than a single label, the system provides principled evaluation and captures the complexity of real-world group emotional dynamics.